Following our blog on the costs of LDI, we received a comment which said:
“To be objective don’t you have to look at the aggregate round trip? i.e., money made from LDI since the start to now? ie you wouldn’t measure the merits of equity investing as the amount of money lost in the most recent bear market.“
The analysis we showed in the first blog was in fact objective, but it is certainly fair to consider LDI in the round, that is how it has performed since its introduction. Unfortunately, we cannot identify from available data what or when investment gains or losses were made by schemes and based on frequent testimony to both the Industry and Regulators Committee of the House of Lords, and to the Work and Pensions Select Committee, it appears that no data has ever been collected on this. Even if the data issue was resolved, the matter would be greatly confounded by the fact that different schemes adopted LDI at different times and in different forms.
We can though offer two indicators as to the efficacy of LDI over its long timespan The first of these metrics starts in mid-2008 and ends in December 2022, which is a reasonable starting point as much prior to 2008 LDI was rarely used, and leveraged LDI was almost non-existent.
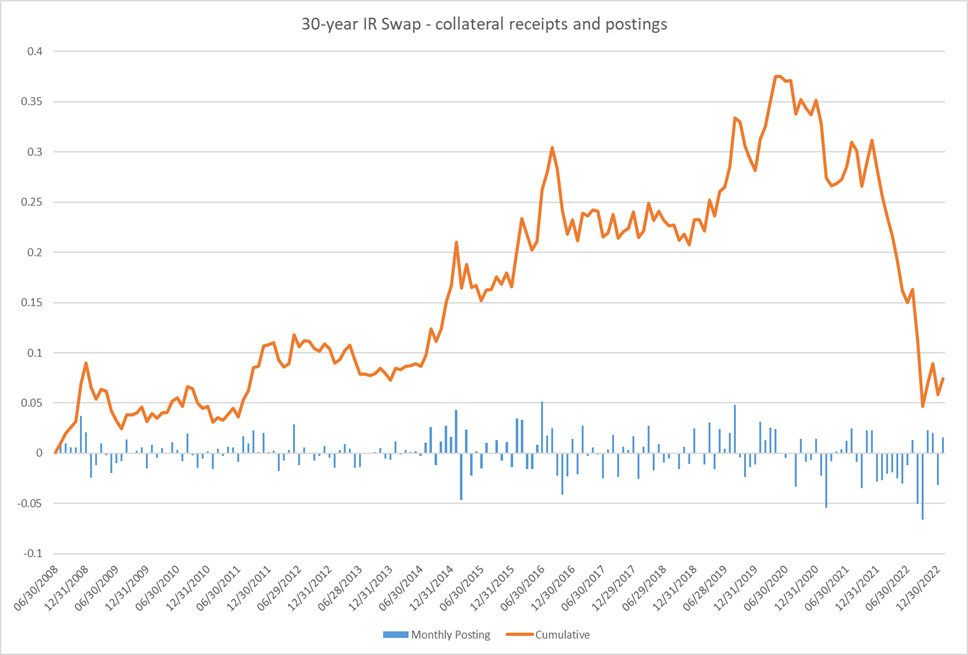
For our first metric, we take a 30-year interest swap opened at the beginning of each month and sold at the end of the month, with a new 30-year interest swap being opened simultaneously. In Figure 1 below, we show the month-by-month profit or loss from this strategy and its cumulative gain or loss. There is no compounding of gains or losses. No trading expenses or haircuts are applied.
Figure 1: 30 Year Sterling Interest Rate Swap Monthly Gain and Loss and Cumulative Gain or Loss

We see that the total gains realised reached a maximum in 2020, at some 37% of the notional value of the swap. It is evident that adoption of this strategy would have been unprofitable from mid-2021 onwards. The total cumulative gain remaining at the end of December 2022 is 7.4%.
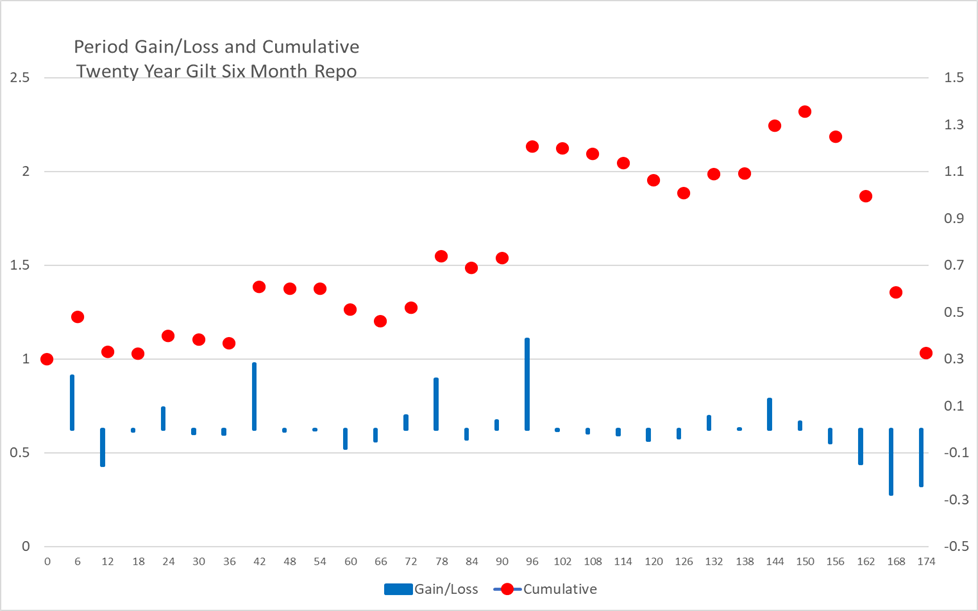
The second indicator is the performance of a 20-year gilt financed by six-month repo. The swap is realised at the end of the 6-month period and the proceeds are reinvested in a 20-year gilt and the repo process repeated. There are again no haircuts or trading expenses. The results of this strategy are shown in Figure 2.
Figure 2: Twenty Year Gilt under Six Month Repo

This strategy shows a similar overall profile to the interest rate swap, but the detail is important. £100 of gilts reaches a maximum value of £231.81 in mid-2020. This higher value than that of the interest rate swap is the result of compounding of gains and losses to this strategy. However, by the end of December 2022, the strategy has given up almost all its gains when it has a cumulative value of £103.14. The largest gain is 38.16% in the first half of 2016 and the largest loss 27.5% in the first half of 2022.
For comparison, and assessment of the significance of these results, a 20-year zero coupon gilt bought in mid-2008 and sold at the end of 2022 would have a present value of 215% of its initial value, a compound rate of return of 5.4%.
It is evident that in earlier periods these strategies had produced substantial returns, in excess of cash gilts, but that these gains have now been almost all given back. If these indicators included realistic allowances for the costs and expenses of implementing these strategies, they would now both have offered negative returns to date, no matter when they were first implemented.
LDI as a useful tool
In her evidence to the Work and Pensions Select Committee, Laura Trott, the Minister for Pensions repeatedly cited scheme funding as having improved from 83% in 2012 to today’s levels and attributed this as a benefit of LDI. In doing so, she was repeating evidence that has been frequently offered by the Pension Regulator as to the efficacy of LDI. The September PPF 7800 funding level of 134.5% is based on the PPF asset estimate of £1,451 billion but the ONS survey estimate is £1,276 billion, in which case the funding ratio declines to 118.2%.
It is interesting to note that scheme assets have increased to 135.6% of their former value using PPF asset figures or to 119.3% using the ONS value. Over this period, the present value of DB pension liabilities declined by 16.6% to £1,076 billion, an effect which can be almost entirely accounted for by the changing discount rate – the 20-year discount function has declined by 19.1%.
It is appropriate therefore to attribute any improvement in the funding ratio to the asset performance over the period. However, asset performance is not just investment performance, as that would overlook £200 billion pounds of deficit repair contributions paid into schemes over the period. Those contributions would account for approximately half of the gain using PPF’s figures and all of it using the ONS survey results.
As well as this, attributing the improvement to gains from LDI is problematic in yet another way. Our 20-year repo financed gilt indicator above, which was a common leveraged LDI strategy for both segregated accounts and pooled funds, has returned minus 25% over the period.
Some final thoughts on LDI and commitments to growth assets
In looking at the extent of the turmoil since the start of 2022, this is evident in some other statistics in the survey ONS survey. From the beginning of the year, cash balances increased by 38% to £102 billion or 8% of scheme assets. Of course, much of that is cash collateral posted with derivatives and repo counterparties. In addition, receivables exploded by 414% to £29 billion – these are the net unsettled sales of securities. Overall, cash and near cash items account for 10.3% of scheme assets up from 4.5% at year end. These are not investments in any real economy and most definitely not investments in the UK market.
Our final observation that can be seen in the most recent ONS numbers concerns the commitment of DB funds to growth assets. Although seen as an increasingly important source of capital, DB schemes divested some £33 billion of equity in the 9 months to the end of September 2022. This is in aggregate for equity globally. However, the direction of investment in growth assets by DB schemes seems very much to be in one direction, while government policy is moving in the other.


Comments